
Heart failure is a serious condition, and many people who have been treated for it are later readmitted to hospital when their condition gets worse. Catching the early signs of such a worsening could make a real difference, but today’s home monitoring usually relies on a few simple measurements, such as weight, blood pressure, and symptoms. The CATCH study uses CARP to collect much richer data from people with heart failure in their everyday lives, with the aim of finding new early warning signs.
About the Study
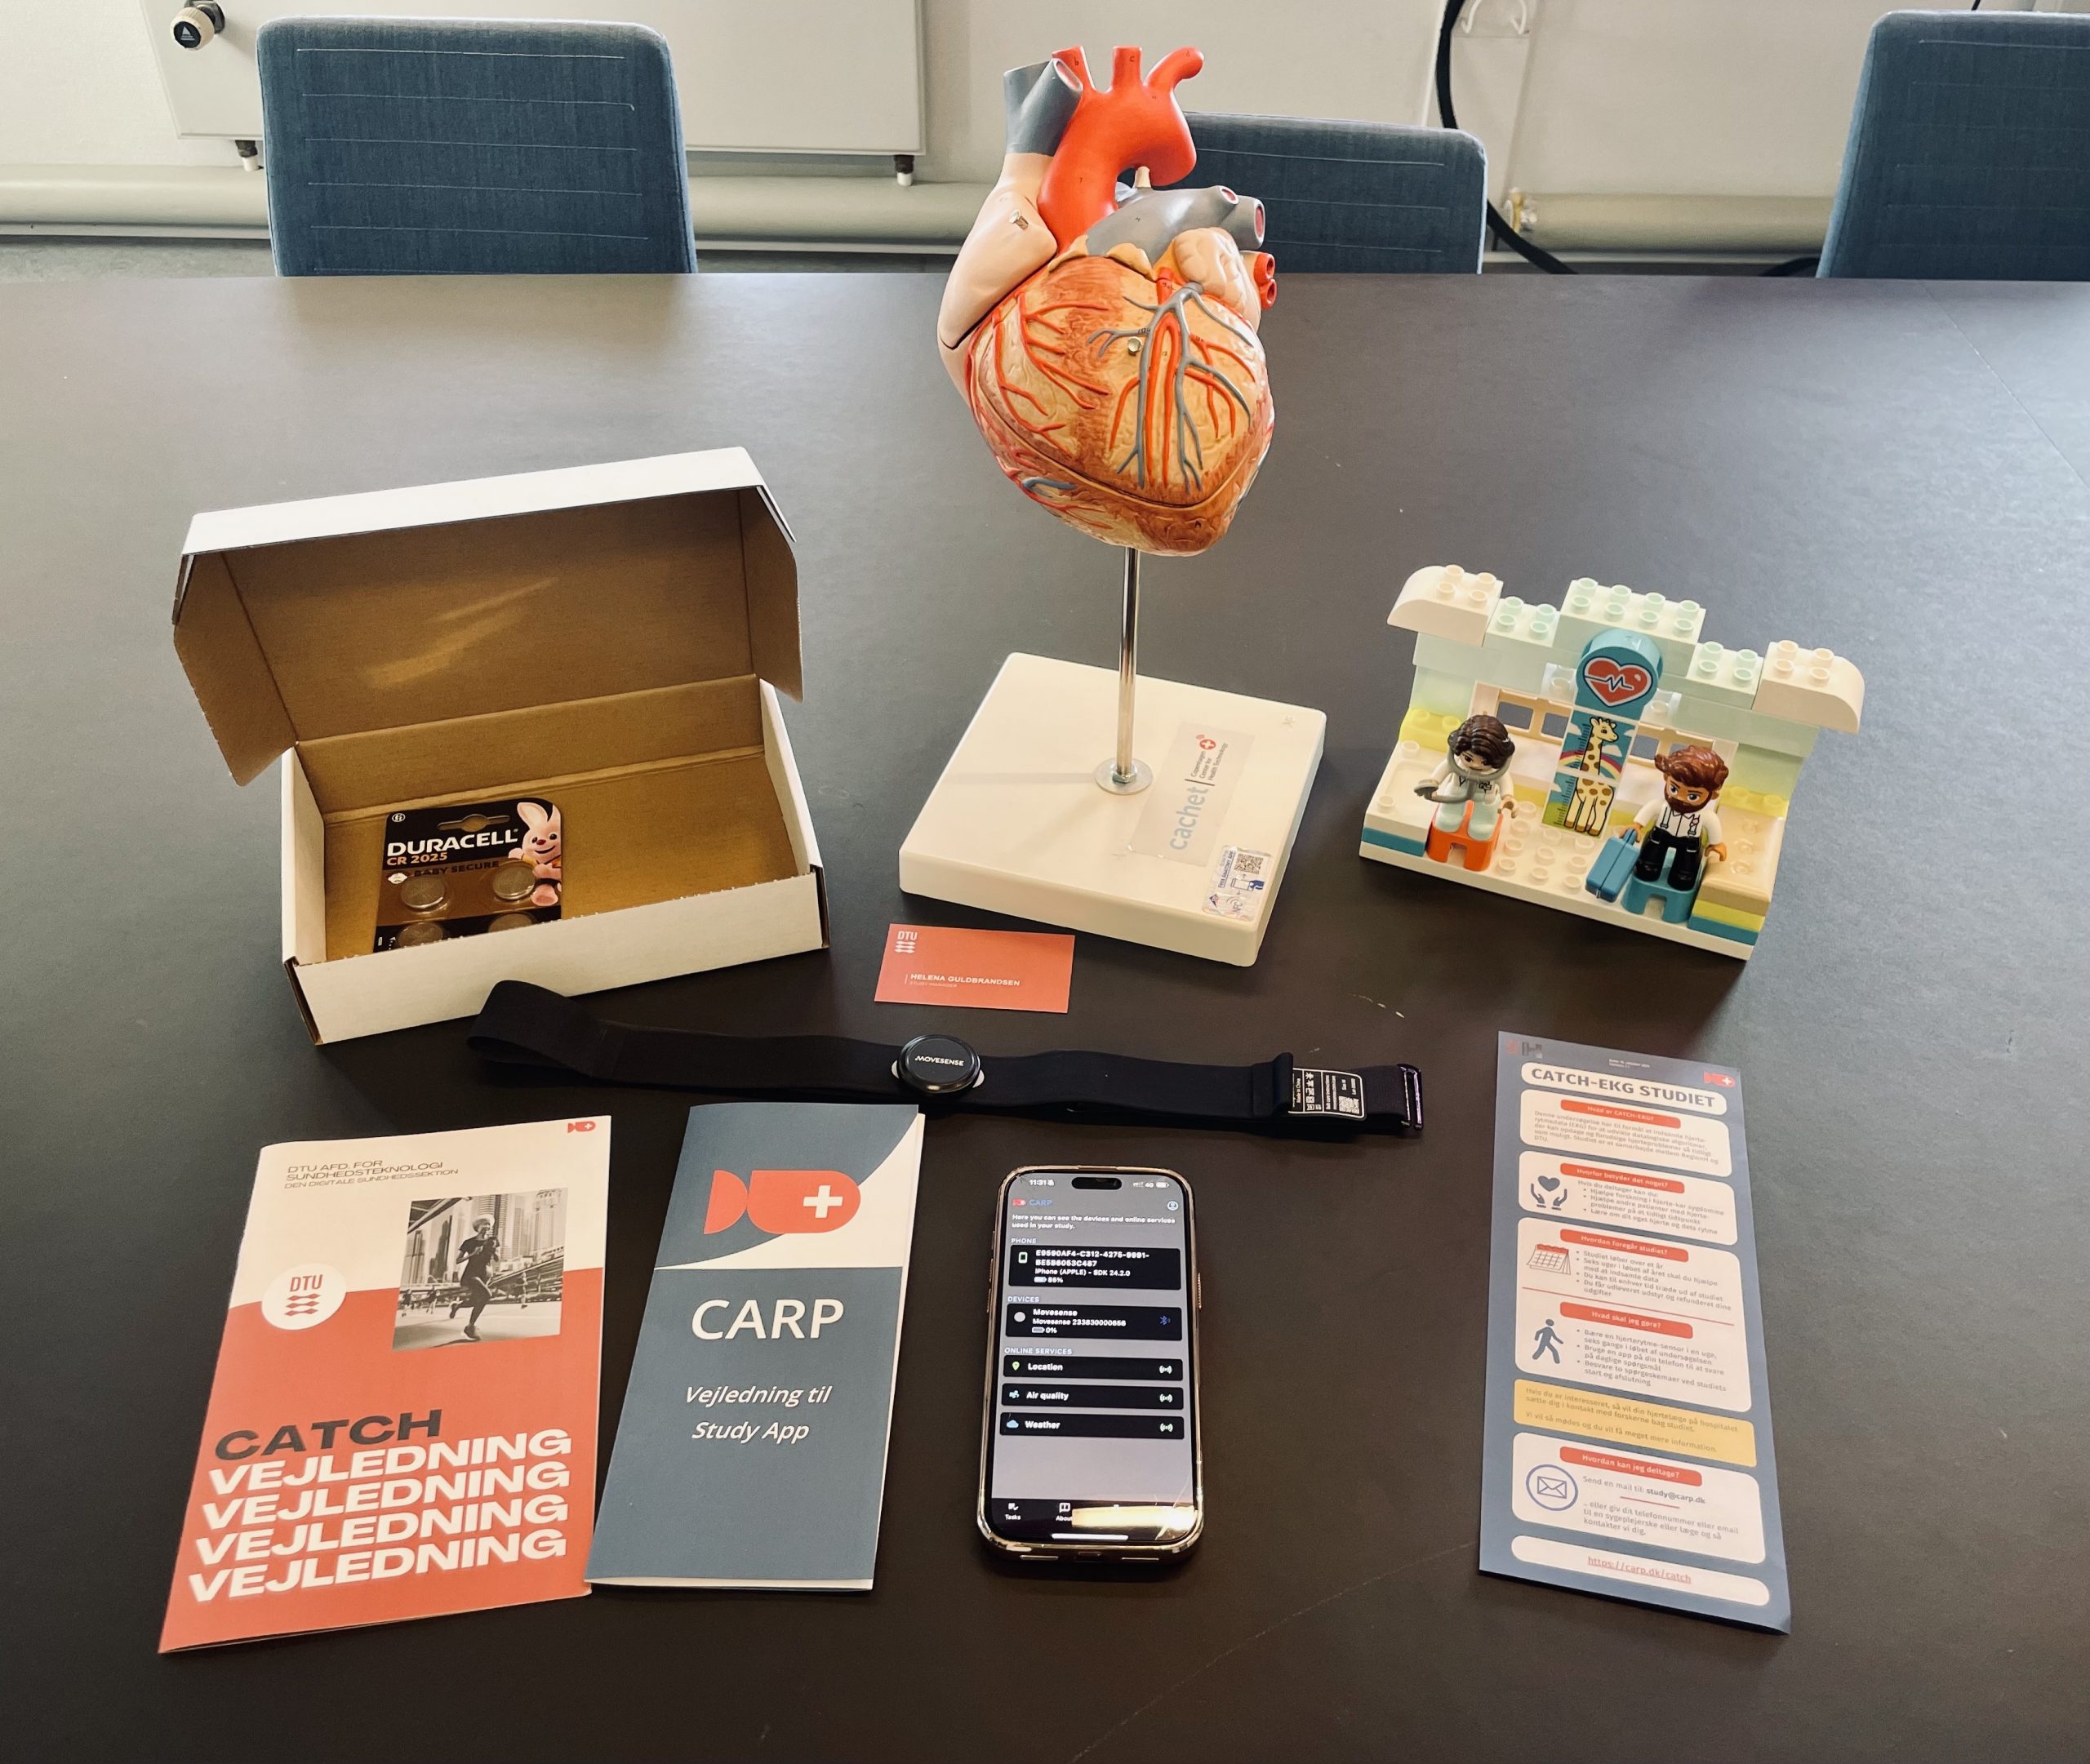
CATCH is a research study run by the Department of Cardiology (Y) at Bispebjerg and Frederiksberg Hospital and the Department of Health Technology at the Technical University of Denmark (DTU). It is part of the CATCH project (Cardio-Share Model for Cross-Sectoral Ambulatory Treatment of Congestive Heart Disease Based on Personal Health Technology), funded by Innovation Fund Denmark.
The study follows people with heart failure for a full year and collects electrocardiogram (ECG) data, data from their smartphone, and their own reports on symptoms and well-being. The researchers will use this data to look for digital biomarkers – patterns in, for example, heart rhythm, activity, and sleep – that signal that a person’s heart failure is getting worse, and to build algorithms that can predict this.
Who Takes Part
The study includes 40 people aged 50 to 80 who have been treated for heart failure at Bispebjerg and Frederiksberg Hospital in Copenhagen and who also have a related condition, such as high blood pressure, diabetes, or coronary heart disease. Participants can live at home or in a nursing home.
What Participants Do
Each participant takes part for one year, as shown in Figure 1:
- Start meeting – participants give their consent, get the CARP Studies App installed on their phone, and learn how to use the ECG sensor.
- Five measurement periods – roughly every three months, participants wear a small ECG sensor on their chest for one week and answer short questions in the app. The researchers call them by phone to start each period.
- Final meeting – after one year, participants answer a few final questionnaires and share their experience in a short interview.
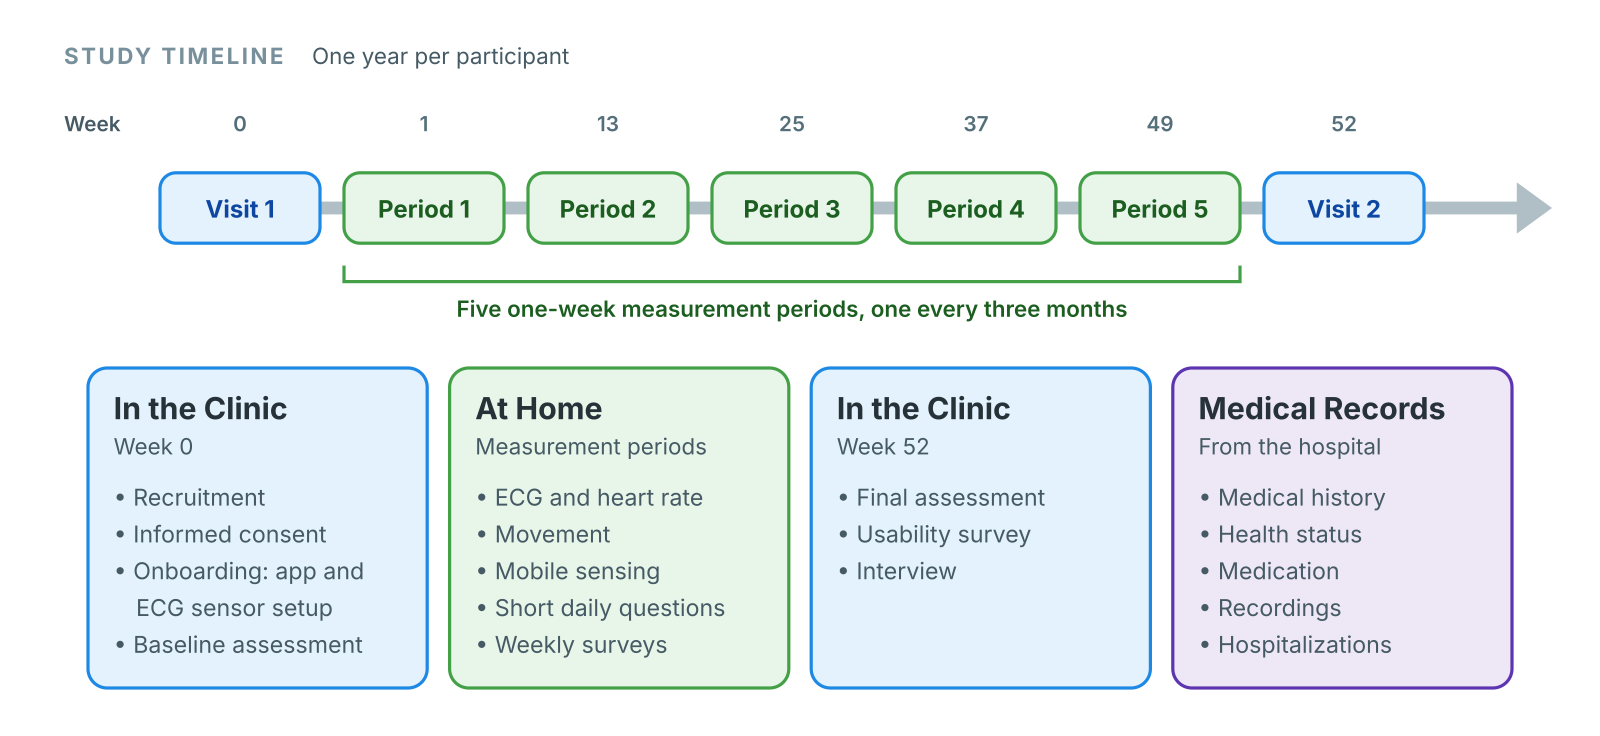
There are no extra clinic visits during the year. Note that the data is collected for research only – no doctor monitors it during the study, so participants should always contact their own doctor if they have health concerns.
How CARP Is Used
CATCH runs entirely on CARP. Participants use the CARP Studies App on their own smartphone, which is built with CARP Mobile Sensing. The study is set up in CARP, and the app downloads the study configuration from the CARP server when the participant joins. During the study, the app:
- collects data from the phone in the background, such as steps, physical activity, location, and screen use, together with local weather and air quality;
- connects to the ECG sensor over Bluetooth and records ECG, heart rate, and movement. The study uses the Movesense HR2 sensor (supported by our Movesense sampling package) or the Cortrium C3+ sensor;
- asks short questions – daily questions about sleep and stress, weekly questions about weight, general health, fatigue, and quality of life, and reports of symptoms whenever they occur;
- uploads all data securely to CARP Web Services (CAWS) at DTU, where the researchers can follow the study and download the data.
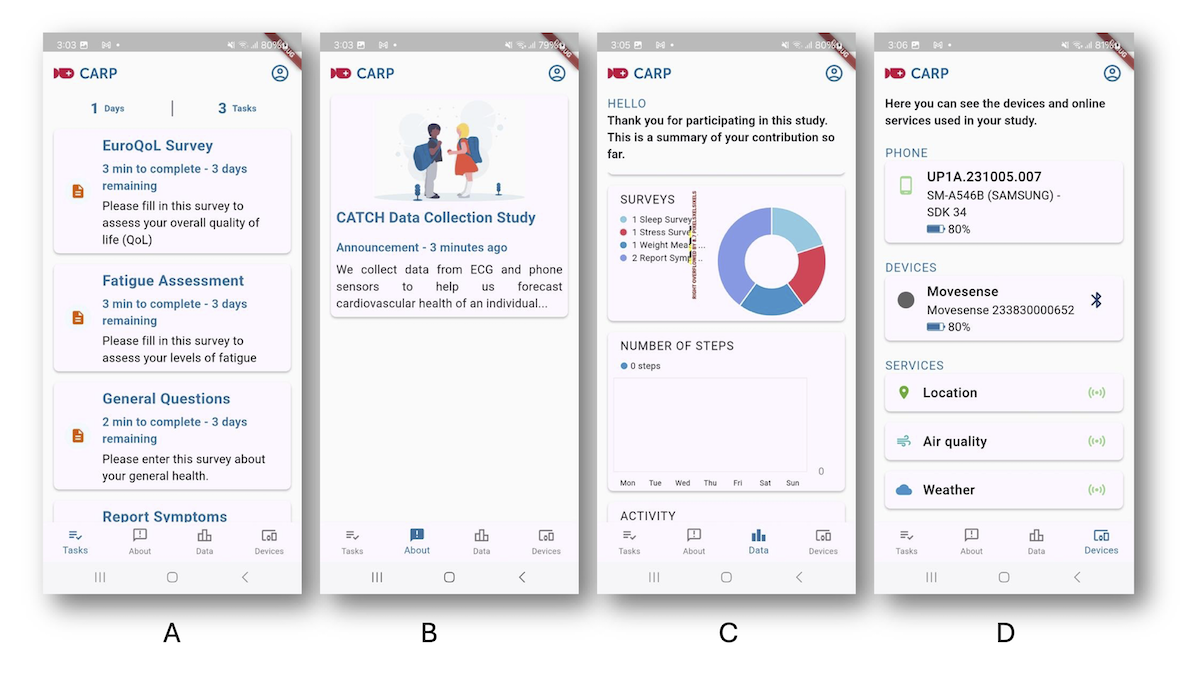
Table 1 shows all the data collected through the app.
| Phone (collected automatically) | ECG sensor (collected automatically) | Participant (answered in the app) |
|---|---|---|
| Once Device information When it changes Battery, screen on/off, location, steps, physical activity Every 30 minutes Local weather and air quality | On connection Device information Continuously ECG, heart rate, and movement When it happens A tap on the sensor to mark a symptom | Once Background information When they occur Symptoms Daily Sleep and stress Weekly Weight, general health, fatigue (FAS), and quality of life (EQ-5D-5L) |
What Happens with the Data
The researchers will analyze, for example, heart rate variability and other ECG features during rest, sleep, and physical activity, and use statistical and machine learning methods to find patterns that come before hospital readmission or worsening heart failure. The study follows the EU General Data Protection Regulation (GDPR) and has been approved by the Scientific Ethics Committee for the Capital Region of Denmark. After the study, the data will be anonymized and shared in a public repository so other researchers can use it.
Status
Recruitment started in January 2025 and is expected to finish by the end of 2026. The first results are expected in 2027.
Want to Know More?
Information for participants (in Danish) is available on the CATCH participant information page.
The full study design is described in this paper:
- Bardram JE, Manimaran G, Cammaerts C, Puthusserypady S, Dominguez H. Collection of Ambulatory Electrocardiogram and Behavioral Data for the Identification of Digital Biomarkers for Heart Failure (CATCH-ECG): Protocol for a Prospective Cohort Study. JMIR Research Protocols. 2025;14:e79651. doi:10.2196/79651